Why is it that companies name files for their own use, not mine?
In doing some research for a client I had the need to download several white papers from a number of research and vendor sites. In most cases, the file name was useless and often absolutely unintelligible. Something like 11.1..1.11.pdf. Oh, I'll remember what that means on Tuesday. Every download required reentering a name that made sense to me.
Think of the wasted branding opportunity for not putting your own name on valuable content! Here's a simple case where thinking about the customer would help and merits a New Year's resolution from every content manager out there. A simple "source - title" taxonomy would work in most cases.
I want an iTunes for my pdfs.
Friday, December 29, 2006
Thursday, December 28, 2006
Marketing Music
Can we hear customer behavior better than we see it?
One often reads about a 360 degree view of the customer. But in reading "This is Your Brain on Music" by Daniel Levitin I wondered if an auditory analogy might be better than a visual one.
The challenge of understanding and interpreting marketing's impact on customer behavior is similar to what the brain has to go through when identifying sources and meanings of different sounds. As I write this I hear a) the click of the keyboard, b) the tock of the clock, and c) the woosh of the heating duct. Right now my brain is trying to deal with three very specific problems as it interprets the data.
1. Undifferentiated information -- the receipt of data is not tagged with the source
2. Ambiguous information -- different sources sound the same
3. Incomplete information -- lost or overlapping sounds
These are exactly the same issues we face in assessing marketing programs: A sale isn't linked to a TV ad, a purchase looks like any other purchase, and the transaction lacks context. While we've had a lifetime (both personally and evolutionary) to process sounds our collective experience with customer behavior is much more limited. As a result our perceptions and assumptions often are used to fill in the gaps. And this is where the risk creeps onto the score.
Wednesday, December 27, 2006
Multichannel Asymmetry
Is what's good for the goose good for the gander?
In a recent Multichannel Merchant article Jim Coogan outlined a variety of reasons why firms that started online have been slow to adapt catalogs as a vehicle. The reasons:
1. Lack of requisite skills.
2. The relatively high (at least perceived) variable costs associated with printing.
3. Certain categories aren't appropriate for catalogs from either a product assortment or target perspective.
While online is good for catalogers, it isn't necessarily true in reverse. The two may be complementary: acquisition vs. repeat.
Tuesday, December 19, 2006
The Play's the Thing
Are we on the same page?
In the Web 2.0 world, 'page views' will go the way of 'hits' as a simple concept that doesn't actually measure anything of relevance. The morphing of browser technology to support more and more application functionality, as opposed to serving up text and images, makes the container less valuable in terms of relating to customer behavior than the flow and context of her actions. One might be tempted to consider this interaction a play since both online sessions and plays consists of a dialog between characters.
Since the customer is king, it makes sense to quote Hamlet: "I'll have ground more relative than this; the play's the thing wherein I'll catch the conscience of the king."
LIFO: Ad Serving Strategy
Do first impressions work?
In the online world there are a wide variety of ways a prospect can come across our products and services. Figuring out which impression(s) are involved in a transaction should be reasonably straight-forward to figure out (at least logically.) Unfortunately, without some creative manipulation of the data it seems that the ad serving community has taken a page out of the accounting handbook. Raw data from MediaPlex uses a "Last Impression or Final Observation" rule. Interesting events, like orders, are associated with the most recent action, which may be a click-thru or a view-thru. So analyzing the impact of total impressions, or their sequence, becomes significantly restricted.
When I request raw data feeds from vendors, I expect to get the raw data -- not some set of low level business rules.
Friday, December 15, 2006
Visions Sell Better than Experience
How do you compete against the 800 pound gorillas?
One of the most successful strategies for winning business against the large, established industry leaders is to paint a vision of where the client is going to be when the project is complete. People will often align themselves with people who know where they are going and how to get there; particularly in uncharted territory.
Mike Cucka of Group1066 recently published a good article about needing a 'point of view' when establishing your brand, which is particularly important in the service industry when everybody else talks about people, process, or technology.
Thursday, December 14, 2006
Another Ah-ha Moment
Are the networks a new source of ideas?
Apparently the folks at CBS had a flash of inspiration. They recently had an idea about using the year-end balance in flexible-spending accounts for over-the-counter medications. Since the money needs falls under the 'use it or lose it' scenario, there is a natural market very willing to spend. They organized a multi-company spot showcasing 19 different OTC products in a medicine cabinet.
Everybody wins with this one.
Television Attribution
Just how do you link TV spots to phone calls?
The traditional method in direct response world is if a consumer calls within a specified window then there is direct attribution. On home-shopping programs this link is explicit, but as one moves from tight integration to looser programs uncertainty creeps in to the equation. Often one might use a limit of 15 or 30 minutes. But certain high-consideration products and possibly some cultures may require discussion and consensus before the call is made. So even if the call-to-action is simply requesting more information, it may be days before the call is actually made.
Understanding the decision making process is important in defining the business rules for attribution across media channels.
Monday, December 11, 2006
Today's Questions vs. Today's Answers
Why do meeting seem to fumble over finding the 'right' report?
Most meetings have one moment where the most senior person asks for something that's not in the reports. While standard reports are good tools for people to manage their own functions, they usually fall short when doing cross functional or multi-departmental meetings. The reason: standard reports focus on a single issue - what are today's answers to yesterday's questions? Am I running my section according to plan?
In strategic, analytic, or just plain planning meetings what is needed is answers today to today's questions. This requires a much more dynamic and fluid environment than any standard report can offer. For this reason the data underpinnings must be appropriately defined and made available.
Friday, December 08, 2006
Email Conundrum
How should email be classified?
Is email a direct mail expenditure? It is direct and it is mail.
Is email an Internet advertising technique? It uses pretty much the same infrastructure.
Not sure it really matters, but it is an example of classifying something based on technology not business or customer sense.
Is email a direct mail expenditure? It is direct and it is mail.
Is email an Internet advertising technique? It uses pretty much the same infrastructure.
Not sure it really matters, but it is an example of classifying something based on technology not business or customer sense.
When Bigger isn't Really Bigger
How does the law of large numbers impact analysis?
In a recent article on media spending, the trends are up for targeted and personal channels: spot, Internet, and Direct Mail (11%, 20% and 8% respectively). Network spending grew at much lower rate (5%).
Large, bulky items like national advertising or Great Lake freighters are difficult to move. So the smaller growth rates for network spending and direct mail actually represent significantly larger dollar figures. The absolute growth of direct mail was still 3 times that for the Internet: $4.71b for direct mail vs. $1.56b for Internet. The absolute difference is twice the current level, so at current growth rates it will take several years to match the contribution dollar for dollar.
Of the $14.07b year-over-year growth in total ad spending, half of the gain came from the channels listed above, even though they account for just less than 30% of all activity.
So when considering growth rates, it is equally important to understand the starting point.
Thursday, December 07, 2006
Beware: Databases Store Low Hanging Fruit
Does transaction data hold all the answers?
The dangers of focusing only on transaction data are explained in a recent article by a colleague of mine - David Bean of Attensity. Since a small proportion of available information is accessible by traditional reporting and analysis tools this is considered a 'costly irony.' We spend money to access the easily accessed even if it represents only 15% of all data. What's needed is the ability to convert free form text into things databases can understand -- entities and relationships. The article gives a good example of decoding explanations in a claims processing system into events and attributes that can be reported.
To some extent this relates to the ability of database systems -- it was always easier to load transactions and other structured data; so that's what we did.
Wednesday, December 06, 2006
Online Attribution
Just what does drive online sales?
There has been a lot of recent posting on online vs. offline attribution, but even online attribution across channels is getting interesting. Imagine a scenario where an online agency works with a company to market their product online through email, banners, search, and affiliate networks and is paid based on performance, e.g., a tiered commission structure by medium.
How does one attribute one order where the buyer has researched several sites, is on both house and prospect email lists, and been routed to a shopping cart via an affiliate network?
To help sort out the data and analytics side, each event should be keyed by owner, source, medium and offer -- not just the traditional client, campaign, placement info. Second, the event data should be massaged to include 'Number of Events', 'First Event/Date' and 'Last Event/Date' for each unique visitor. This will help with business rules based on primacy or recency. On the other side of the equation, sales transaction data should be appended with 'Media Source' and 'Number of Events' in order to help understand what level of activity is required to generate orders.
Tuesday, December 05, 2006
Customer Data and Email
Why do these seem like oil and vinegar?
A major complaint with the email channel is the lack of customer data according to Ken Magill's article this week.
Seems almost counter intuitive that the most personal of mediums suffers from a severe lack of contextual data about just who is receiving the data. Just like the emergence of segmentation in email, time will show an increase in the availability of direct or indirect customer data. At a minimum geo-location should be the starting point, just like it was in Direct Mail.
With Direct Mail spending at 6 times Internet spending; the old dog can still teach a few tricks.
Monday, December 04, 2006
Marketing Dashboards: Analog Returns
Why are we using analog technology in a digital world?
Because it makes it easier to absorb information quickly. This is a fact learned the hard way by the auto industry after they switched to digital displays. A blue number just isn't the same as seeing the needle approach the red line.
It seems that the same is true in marketing. A recent NYT article states that direct mail is up even in the days of digital content and delivery. It seems that last year was the first time that bulk (direct) mail exceeded the number of first class pieces.
Friday, December 01, 2006
Indices: A Faster way of Comprehending
How can we better understand raw data?
Assimilating a lot of raw numbers is often easier when they are expressed as indices. The reason is that people are often most interested in comparative differences and don't need to know the absolute figure. As long as measurement is consistent, then relative changes are easier to digest.
The two common uses of indices include:
1. Trending: Are we going in the right direction?
The classic example is the performance of the stock market over time. Given a $100 at some point in history, where would it be today?
2. Group Comparison: How does one group differ from another?
This may be people, markets or products such as Brand Development Indices (BDI) comparing per capita consumption across markets or segments.
Thursday, November 30, 2006
Attribution Challenge
How do we align sales and marketing?
A recent post by Kevin Hillstrom challenged the analytic and vendor community to help figure out the problem of multi-channel sales attribution. When using multiple delivery vehicles and providing multiple shopping outlets the attribution question gets a bit muddy to put it mildly.
Two points:
1. As noted the other day, attribution shouldn't necessarily be used to measure productivity.
2. The next challenge should include other on-line tactics like microsites and affiliate networks.
That said, it's still a worthy cause.
Tuesday, November 28, 2006
Multichannel Attribution Headaches
Should we always account for all sales?
One thorny problem in multi-channel retail is the attribution of sales to one of several marketing programs. Imagine a retailer which uses infomercials and 800 numbers, an e-commerce page on the corporate site and an integrated online campaign. To keep the example simple, the productivity of each medium is the ratio of revenue to costs. The 800 number and on-line campaign are arguably easier to account for; but the e-commerce site has no good way of tracking back to spending -- just where was the impetus to purchase generated? Ultimately the business question is: Which medium is more efficient or productive in terms of generating sales?
A common approach is to assign the mystery sales to a channel based on some sort of allocation. Examples of the basis for such analysis include a) dollars spent, b) dollars received, or c) an arbitrary/benchmark/standard figure.
If the goal of the exercise is to understand the efficiency of different media, then the allocation should be excluded from the analysis. Any conclusion which includes such allocations is going to be distorted based on the assumptions about how to divide the unaccounted sales.
Two common analytic problems exist: 1) When using a productivity measure that is based on the ratio of revenue to costs then the 'law of large numbers' makes it harder to prove that the 800 pound guerilla is better than the 90-pound weakling because of the big denominator; 2) When allocating from the top down, the problem is one of algebra not of productivity. By definition there is one allocation figure at which the efficiency of the two media is equivalent making it possible to game the analysis and prove a desired conclusion.
In sum, if the question is about productivity and efficiency then avoid the allocation step altogether and keep it apples to apples.
Monday, November 27, 2006
Paying for Spam
How much is my information worth?
It appears everything has a price, even unwanted email.
Ken Magill highlights an interesting twist in the spam world. A new company, Boxbe, allows users to set a financial threshold at which mail from unapproved senders will be allowed through a challenge-response gateway.
Might be interesting to see what $0.01, $0.10 and $1.00 allows through.
Wednesday, November 22, 2006
Holiday By the Numbers
How much turkey will we eat?
The census bureau, the know of all things numeric, released its 2006 figures for Thanksgiving.
The highlights:
The census bureau, the know of all things numeric, released its 2006 figures for Thanksgiving.
The highlights:
- 265 million turkeys, almost one per man, woman and child
- 664 million pounds of cranberries
- 1.6 billion pounds of sweet potatoes
Happy eating!
Tuesday, November 21, 2006
Name and Address: Keys to the Kingdom
Should name and address always be combined?
In most situations analysts need the ability to track people over time. Whether it is to assess contact strategy, compute life time value, or simply report customer file growth a consistent means of identifying unique individuals is required.
Often name and address are used in tandem to identify specific individuals, but that is neither a foolproof strategy nor always appropriate. One example: In the cable business the concept of 'homes passed' or those with a piece of coax in the wall is critical because it relates to large capital expenditures. Thus, the network folks usually don't care who lives at a given address but only whether that address is wired. Conversely, marketers are more interested in people because they consume products and services. They particularly want to know when they've moved so they can select the appropriate services.
A common customer table which contains both names and addresses falls somewhat short of satisfying business needs. A better solution rests in separating names and addresses into separate master lists. The intersection of the two, i.e. people who have access, represents the target universe.
Friday, November 17, 2006
Reasons Why we Model
What business problems need models?
The use of modeling generally falls into one of three categories.
1. Prediction -- the most common interpretation is about predicting the future, either in aggregate or at the individual customer level. Examples include sales forecasting, acquisition and propensity scores.
2. Classification -- modeling is also useful for categorizing people (or items) into buckets. The goal is to minimize the differences within a given group while maximizing the differences across groups. Good segmentation schemes rely on classification so that messages can be better targeted.
3. Estimation -- plugging holes, e.g. missing data, or calculating a new metric, e.g. Life Time Value, represents the third area of modeling. This differs from prediction in the sense that there is no time element involved.
Prediction and estimation often use a similar set of techniques, just different data and assumptions; classification problems are best solved with a different set. Thus, any good modeler will want to understand the business problem and objective first before reaching into his satchel to pull out a tool.
For another view, see Katie Cole's piece in MultiChannel Merchant.
Value Drives Hygiene
What is the cleanest data in an organization?
Arguably the cleanest customer information in any organization is Accounts Receivable, or who owes us money.
It appears that the willingness to expend effort to clean and maintain data is directly related to the value that information ultimately provides. If there is difficulty in justifying cleaning and managing customer information then the alignment to the metrics and objectives that really matter to an organization isn't quite right. It might be time to go back and revisit the fundamental objectives.
Thursday, November 16, 2006
Vendor Client Relations
What should we be asking for?
Charles Pearlman gives a good discussion on the difference of what clients want and what vendors want was recently published in DM Review. A key point is that people often ask for things in terms they THINK the other side wants to hear. Clients don't want surveys and models, although that is how vendor pricing is done, they want the recommendations and actions that come of such services.
The same point can be made about internal services as well. Brand managers often need help in figuring out what do to. As recommended in the article, walking a mile in their shoes is good for the soul, or is that sole?
Wednesday, November 15, 2006
Whiz Bang Techniques
What's driving the future of analytics?
In an article on trends in analytics, Rick Watrall of MarketingNPV summarizes the state of the industry:
In an article on trends in analytics, Rick Watrall of MarketingNPV summarizes the state of the industry:
The critical commonality among the trends above is that none of them involve the next "whiz-bang technique" coming down the pike. The future of marketing analytics will be determined more by people-driven processes, technology, and creative applications of unique solutions to individual situations.Of the drivers, I think the people-process is the most important driver. Successfulul adoption of analytics should come from a fundamental desire to understand not from the application of some technique or tool.
Analysis: Throw Away the Math
What does successful analysis look like?
At the turn of the century, as in the last one, economist Alfred Marshall summarized his rules on analysis.
1. Math is nothing but a shorthand language
2. Translate the equations back into words or theory
3. Illustrate with examples or stories from real life that are important.
4. Burn the math.
5. If no words or stories emerge, then burn the theory – don’t hold on to the numbers.
So when preparing reports and particularly presentations pepper them with real lifanecdoteses and stories and leave the equations and formulae in the trash bin.
Note: The story was related in Brue's "The Evolution of Economic Thought, 5th ed.," pg. 294.
Tuesday, November 14, 2006
Genesis Question
What is the one thing you should always ask technology vendor?
The beginnings of every software company shape its product and thinking for generations. The choices made in that first release will dictate what the product is good for and by inference what it isn't. Therefore, when evaluating software vendors ask them to describe what the original problem they attempted to solve and who that market was. You'll often find that after several iterations, the apple hasn't fallen very far from that particular tree. If you're looking for peaches, then find another tree.
The beginnings of every software company shape its product and thinking for generations. The choices made in that first release will dictate what the product is good for and by inference what it isn't. Therefore, when evaluating software vendors ask them to describe what the original problem they attempted to solve and who that market was. You'll often find that after several iterations, the apple hasn't fallen very far from that particular tree. If you're looking for peaches, then find another tree.
Monday, November 13, 2006
Marketing FICO Scores
What can we learn from the underwriting business?
Credit scores are based on statistical analysis of account and payment data. Generally they focus on determining the likelihood of making a bad decision when underwriting a loan. Higher risks are associated with higher returns for the lender - or larger payments for us. This is all then translated into a score -- FICO or the new VantageScore. What is clearly not discussed is how the score is actually created nor the accuracy of the underlying model -- those are trade secrets.
A quick look at the real estate or automotive section of a newspaper shows that whatever statistical tools are used and their validity, the results have real economic impact.
A conference on the Validation of Consumer Credit Models made the point.
Rather than establishing some arbitrary statistical criteria for a model's performance, the central question for validation is whether the model is working as intended and producing results that are at least as good as alternative approaches.The above is good advice for propensity models - be they acquisition or churn. We shouldn't talk about r-square, K-S, or goodness of fit but is our customer base growing the way we'd like?
Profitable Experiences
Is the tail wagging the dog?
A recent article by Martha Rogers of 1to1 fame discussed the benefits of Continental Airlines' loyalty program. In it there is the following:
A recent article by Martha Rogers of 1to1 fame discussed the benefits of Continental Airlines' loyalty program. In it there is the following:
Each customer has an associated customer value metric, from one to 100, based on the profitability of that passenger. By treating different customers differently based on their value, Continental gives each group the experience its members are looking for.But here's the rub, the experience people look for may only loosely relate to their profitability. Certainly experiences have costs and aligning the rewards and perks with value is an appropriate goal. The trick is to figure out how to make the desired experience profitable and not the other way around.
Friday, November 10, 2006
Targeting a Small Car Niche
When are less sales more?
In today's Wall Street Journal, an article described the marketing plans for Toyota's Scion. It seems that they are limiting next year's production to below this year's sales and shifting budget to event and experiential avenues. They even find MySpace as being too mainstream - imagine that, a car manufacture eschewing social media as so 2005.
Typical sales analyses and forecasts usually end up in trying to justify increases in unit sales or share under the premise that more is always better. It takes judgment and executive decisions (and a bit of moxi) to reject the spreadsheet models in favor of what's important.
Restaurant Marketing
What can we learn from Chefs?
"Heat: An Amateur's Adventures as Kitchen Slave..." quotes Mario Batali as describing the business in its rawest form as buying food, fixing it up, and making a profit. I guess the rest must be marketing.
Anthony Bourdain in "Kitchen Confidential" makes a strong case why creativity and innovation are NOT desirable when hiring line cooks or sous chefs. Customers want the same thing they had last time, they are not looking for a creative variation.
It seems that a successful restaurant is about understanding expectations of a target market and then consistently meeting (or exceeding) them. Sounds familiar.
Thursday, November 09, 2006
Selecting Square Pegs for Round Holes
Why is marketing analytics a struggle?
One of the underlying reasons for the frustration rests on the fact that technology and software in particular is extremely biased. It is (was) developed with a particular objective or goal in mind. If the current need has a different goal then trouble will emerge, usually sooner rather than later.
Consider the case of the marketing database. Today most systems are built on some form of relational database and usually have a 'customer table.' When drawn on the blackboard customers appear as rows and their attributes appear as columns. There is no bias in favor of rows or columns at this point - I should be able to add a new attribute just as easily as adding a new customer. However, when this logic was first implemented the designers focused on transactional applications where there were lots of rows coming and going, each with a stable set of attributes - think credit card transactions, reservations, retail sales, phone logs, etc. These systems optimized manipulating a row at a time for both speed and audit reasons. So it is easy to insert, update or delete a single customer record. This legacy still exists in nearly all commercial products.
But, and here comes the effect of that bias, marketing analysis is about comparing and contrasting groups of customers. How do responders differ from non-responders? What is the appropriate contact strategy? Who should we target? etc. This style of work tends to focus on the attributes of the entire customer base rather than a single customer at a time. As a result, marketing analytics needs an entirely different set of database functions.
In the language of database developers the commands for manipulating rows are generally much more powerful and flexible. The ability to add, amend, or drop a column (particularly by a user) is nascent at best.
I'd like to be able to add columns (propensity scores, various segmentation schemes, current and future life-time value, etc.) with the same ease that I can add another customer record.
Disclosure: I used to work for a firm that works on solving this problem and know what is possible when the emphasis is turned 90-degrees. There is also a start-up focusing on part of this topic as well.
Moths to Light Bulbs
Do new tactics risk losing one's direction?
Moths confuse light bulbs with the moon and hence lose their sense of direction.
In an article on new media Douglas Rozen makes a similar point about marketing when he asks 'when did "cool" become a marketing metric?' The point is that just because something is bright and shiny it doesn't necessarily make it relevant to marketers or consumers. He uses examples about consumer-generated content to make the point - sponsoring ads for the Super Bowl or MySpace/YouTube videos.
It's a difficult balancing act. Leveraging new channels, interaction mediums, cost structures, etc. will always be uncharted territory. Until some semblance of understanding can be reached let's thank those willing to experiment in a whole new laboratory. But there should always be a clear direction and objective.
Wednesday, November 08, 2006
Equations as a Brand
So what does THIS mean?
With all due respect to Fair Isaac and the work they put in to raise the bar on quantifying customer behavior, the following banner portrays the wrong message.
 As an analyst, my first thought was to try to figure out the equations.
As a business person, my first thought was to pass it down the line.
Guess which option won?
New Political Divide: Up vs. Down
Is Left - Right on the way out?
A quote this morning in Hotsoup sums up the issues many have with politics and its attendant media coverage.
While the up/down question is the right one, the Huckabee blog is still very left-right oriented. Guess the message hasn't gotten down to the handlers yet; so politics as usual.
The analogy sounds eerily similar to many analytic discussions with business leaders. They want to know whether we're moving up or down and often hear assumptions, technical limitations, qualityquatlity problems.
A quote this morning in Hotsoup sums up the issues many have with politics and its attendant media coverage.
"The average person in politics is thinking horizontally and talking about things right and left," Gov. Mike Huckabee of Arkansas, a potential candidate for the Republican presidential nomination in 2008, told HOTSOUP. "The average American thinks vertically - what they're interested in is not party ideology, but, 'Are you going to lift me up or take me down?'"
While the up/down question is the right one, the Huckabee blog is still very left-right oriented. Guess the message hasn't gotten down to the handlers yet; so politics as usual.
The analogy sounds eerily similar to many analytic discussions with business leaders. They want to know whether we're moving up or down and often hear assumptions, technical limitations, qualityquatlity problems.
Tuesday, November 07, 2006
Fantasy League for Marketing
How do you measure a changing market?
In yet another good read, Michael Lewis of "Moneyball" and "Liar's Poker" fame has written about the evolution of football in The Blind Side. In general its about game-changing events as they relate to a single position: the left offensive tackle. In particular its about a single individual who plays that position.
It also hints at the point that metrics only appear when the game changes in a substantive way.
If you ask how the defenses of the 50's, 60's and 70's compared to those of the 80's, 90's and 00's in terms of sacking the quarterback --- you're stuck. The NFL didn't keep individual sack statistics until 1982, which coincides with the advent of Lawrence Taylor (who didn't actually lead in that category until 1986) as the most feared player in football.
Multi-channel, integrated, or media neutral programs have changed the face of the market. What we don't quite yet have a handle on is how to measure the value of those campaigns. What metric reflects the impact of a campaign? Once we answer that, we could start a fantasy league for marketing.
Language Skills: Statistical Abstraction
Does how we talk impact what we say?
In a recent DM Review article, the authors discuss different ways of accounting for two types of error based on using a sample: how tight the estimates are around a given value (precision) and how far the average estimate is from the truth (bias). Got to give them credit for avoiding terms like "stochastic" in the discussion.
However, what's missing in this discussion is why this matters from a business point of view. Or in the words of another economist - what is the 'oomph' of the analysis? It would have been helpful to understand scenarios where precision is more important than bias and vice versa. For instance what class of problems should focus on consistency, even if biased, versus overall accuracy?
This article left me thinking that it's no wonder firms like Williams Sonoma, Capital One, and Cisco are currently looking for senior people to manage customer information and analytical teams while simultaneously talking with C-level executives.
Monday, November 06, 2006
Limits of Transaction Data
What can transaction data tell you?
On the one hand historic data can tell you a lot about a customer's behavior and with a bit of pixie dust can probably hint at the future.
However, it fails on two important fronts:
First, it is exactly what it is -- a firm's own transactions. Not category activity, not context, not reasons, and not intent.
Second, it is based on a given set of business rules and assumptions about how the world works. It does not support answering 'what if we changed the ...' type questions.
Without a doubt, marketing databases should include transaction history. Analyses built on transaction data confirm whether marketing activities impact behavior, at least at the macro level. But like many puzzles, it is only a starting point so don't stop there.
Like John Mayer, I'm Waiting on the world to change.
Merger of Like Minds
When does 1+1=3?
Last week two of my favorite reads, Marketing Experiments and MarketingSherpa, announced they were merging. The combination of real laboratory experiments and secondary research, including case studies, provides a significant resource for determining what really works. I wish Anne Holland and Flint McGlaughlin all the best with their new company.
Now, if only they'd add traditional media to the mix.
Friday, November 03, 2006
Ten Tips on Accountability
Tom Breur publishes a monthly newsletter on a variety of data-related topics. The October list covers Marketing Accountability.
Good thoughts with a few that run counter to prevailing buzzwords.
Good thoughts with a few that run counter to prevailing buzzwords.
Memo to Software Vendors
Can software tools analyze?
Just went through my notes from the DMA exhibit hall and the number of 'analytic' mentions is at an all time high. But at the end of the day analysis is about understanding and determining if those new findings matter. These are both human endeavors.
So, I'd argue tools facilitate the process but rarely actually do analysis. I'd also argue that most tools focus on the low hanging fruit of manipulating the data they can get their hands on rather than helping with understanding or oomph.
Thursday, November 02, 2006
The Challenge of Definitions
Just how do we define 'customer'?
One of the most difficult things in data-driven marketing is getting agreement on what some commonly used terms actually mean. It is somewhat unfortunate that databases and computers are totally ignorant -- they simply reflect what we tell them to hold and do, so we have to be explicit in our instructions.
The answer to the above question is the proverbial "It depends." Only somewhat tongue-in-cheek I've argued the following funnel:
Sales -- any warm body
Marketing -- anyone with a need
Legal -- anyone we're allowed to talk to
Finance -- anyone who can issue a purchase order
Accounting -- anyone who owes us money
Similar funnels can be created for terms like 'revenue' -- contracted vs. booked vs. collected.
Rightfully or wrongly data-driven marketing requires us to sharpen our definitions to the point that computers and databases give us the right answers.
Chart Spinning
Does the orientation of graphics make a difference?
In this morning's mail was the following humor.
Unfortunately, rotating 180 degrees still portrays the same trend. Only difference is that the speakers will be standing on their heads.
90 degrees in either direction might have worked though.
Why? Because most of us naturally read left-to-right so assume that time is meant to pass that way as well in graphs. Hence the use of the horizontal axis to represent time in trend charts. Fighting a 'natural law' like this makes interpretation and analysis extremely difficult if not misleading. But possibly a shorter meeting.
Wednesday, November 01, 2006
Strange Bed Fellows: 6 Sigma and CRM
What do operations research and creative have in common?
Turns out the answer is quite a lot. Six-sigma, known for its statistical rigor focuses a lot on the customer because the fundamental tenet is this:
Customers deserve to pay the least amount possible while firms deserve to make the most possible.
As a result understanding precisely what customers need becomes a critical component. "Voice of the Customer" is a central theme with a clear focus on segmentation to better understand the nuances of need. So, maybe there are a few more things we can learn from the stopwatch gang.
Tuesday, October 31, 2006
Three Questions for Finding New Markets
What can we learn from all the talk about innovation?
In sum, it appears that new markets emerge when the rank ordering of current product features is upended or extended to focus on new priorities.
This may take the form of 'breaking the rules', i.e. relaxing an assumption that prevails in an industry -- like NetFlix did with late fees or iPod did with the assumption that it was about technology.
It may take the form of extending the feature set to add new items of value -- like Cirque Du Soleil did with multiple productions and artistic dominance. Kim and Mauborgne's Blue Ocean Strategy uses this approach in the creation of a visual strategy canvas.
Customers typically ask for more of the feature that you market -- sell based on capacity, they'll ask for more capacity. Sell on speed (not a very defensible proposition), they'll ask for faster. In short, current customers are conditioned to respond pretty much in the way they are sold. So asking them what they want is risky from an innovation point of view. This is pretty much the argument in Innovator's Dilemma, Clayton Christensen's work on understanding why firms fail.
This suggests that there are three questions one must ask when looking for new markets:
1. What are all the possible features we could include in a product?
2. What markets emerge if we change the rank ordering of currently available features?
- portability is more important than capacity
3. What markets emerge if we swap new features for current offerings?
- theme and story replace animals
The final point is understanding the attractiveness of a market; as is well proven that depends on where you sit. Innovative, particularly disruptive, markets have the benefit of being pure upside with no base to protect. So most innovation appears to come from small, upstart companies with 'nothing to lose.'
Monday, October 30, 2006
Cost Savings Are Customer Benefits
How do customers react to cost saving initiatives?
My library (yes library) has introduced radio frequency tagging, self-check out, automatic check-in, email and phone alerts, and a few other technical goodies. Now, the original purpose of this initiative was to improve the efficiency of material handling -- something like 7% annual growth with over 12 million items in circulation. Classic problem: How do we do more with same resources?
This may be another example of Jevon's Paradox --- increase in efficiency is supposed to reduce consumption but actually creates a greater demand. I know my use is up: I can log on to the library, search, and have the book, CD, or DVD shipped to my local branch. When its there, they leave me a voice mail.
According to Jim Cooper, Director of the county library system ....
Haven't tried the library's books to download; that's next.
My library (yes library) has introduced radio frequency tagging, self-check out, automatic check-in, email and phone alerts, and a few other technical goodies. Now, the original purpose of this initiative was to improve the efficiency of material handling -- something like 7% annual growth with over 12 million items in circulation. Classic problem: How do we do more with same resources?
This may be another example of Jevon's Paradox --- increase in efficiency is supposed to reduce consumption but actually creates a greater demand. I know my use is up: I can log on to the library, search, and have the book, CD, or DVD shipped to my local branch. When its there, they leave me a voice mail.
According to Jim Cooper, Director of the county library system ....
According to the Public Library Data Services Statistical Report, we are one of the busiest and most efficient library systems in North America; I think our staff does an outstanding job considering the volume of materials we move and the number of patrons who visit our facilities. Nevertheless, we constantly look for ways to improve our service.
Haven't tried the library's books to download; that's next.
Marketing Lights Up Las Vegas
What makes the meter go round?
In an excellent piece on the data centers required to power the search engines, George Gilder describes the future and the need for more infrastructure. Since search revenue is 95% advertising marketers might want to know what they're paying for. It turns out those 10c Google clicks add up to cost of the electricity necessary to light up Las Vegas.
So, what are the major players doing to keep costs down? They're building huge data centers along the Columbia River. Why? Two reasons - first, cheap hydroelectric power; second, close access to the Internet backbone.
Now it is a good thing that the Army Corps of Engineers and Mulholland didn't already divert the Columbia to Los Angeles. Yes, this was considered. For a good read on the history of water in the West I suggest Marc Reisner's "Cadillac Desert."
Friday, October 27, 2006
Marketing Metrics - Finding common ground
What time is it?
Up until the late nineteenth century there was no way to agree on an answer. Every location had its own time- there were thousands of 'noons' in the US alone. The establishment of national railroads and the prime meridian finally gave a reason and a method for setting a common basis for understanding. Imagine a train timetable where you might arrive before you depart and providing you with no sense of duration. In 1884 a fixed location of 0 degrees longitude was established at the royal observatory in Greenwich allowing location and hence time to be defined precisely. From then on things made sense.
In thinking about marketing metrics it seems we're still in the late 19th century with hundreds to choose from and consultants promising to help find the right ones. Finance went through similar throes and ended up with one or two with cash flow being on everyone's short list.
It might be time to think about the ones that really matter at the end of the day.
Wednesday, October 25, 2006
Two Strong Images: Luxury and Mud
Is this a brand too far?
The Lincoln Mark LT pickup truck, yes pick up, strikes me as a contradiction. To me Lincoln symbolizes luxury and a ride to a New York airport. The idea that I'd want a pickup truck (and a very big one at that) from the company I associate with entirely different set of emotional cues is pushing it.
Must be going after the suburban Hummer crowd.
Electronic Lists: End of the Data Card
Did Oscar Goldman have it right, can we rebuild a business?
The list business is shifting as aggregators provide access to 100s if not 1,000s of different lists. If they have all those lists I no longer want individual PDFs for each individual list, I want information to help me choose the combination of lists that satisfies my needs.
I want to drop one list on top of another to see the overlap and net-down. I also want to use my housefile as well. Lists with high duplicate rates may outperform other sources due to intrinsic factors not readily seen in ‘factoids.’
We need to separate the cost model from the need model. I'll pay for performance not volume.
PS – We have the technology and it won’t cost $6m
Monday, October 23, 2006
Marketing's Three Rs Require Data
Why is information so important?
Originally, the three R's were Reading, 'riting and 'rithmetic --- although I'd have flunked with that spelling. Mila D'Antonio's blog reported the new mantra from the DMA:
All three are data centric concepts - one certainly can't determine results or relevance with out some objective measure and feedback. Responsibility is also data driven -- if we fail to live up to our side of the trust bargain customers will speak loudly with their voice, feet, and checkbook -- all things we can measure.
PS: Other uses of the R.
Reading, Writing, RFID in logistics.
Reduce, Replace, Refine in animal testing.
Reduce, Reuse, Recycle in the environment.
Originally, the three R's were Reading, 'riting and 'rithmetic --- although I'd have flunked with that spelling. Mila D'Antonio's blog reported the new mantra from the DMA:
....John Greco, president and CEO, of the Direct Marketing Association, called for widespread use of something he's coined the Three R's: Results, Responsibility, and Relevance. He said they represent a delicate balance in the power of direct marketing. 'Our goal is to build a bridge of trust with consumers,' he told the crowd.
All three are data centric concepts - one certainly can't determine results or relevance with out some objective measure and feedback. Responsibility is also data driven -- if we fail to live up to our side of the trust bargain customers will speak loudly with their voice, feet, and checkbook -- all things we can measure.
PS: Other uses of the R.
Reading, Writing, RFID in logistics.
Reduce, Replace, Refine in animal testing.
Reduce, Reuse, Recycle in the environment.
Marketing Database: Secret Sauce to Success
How do you collect Marketing's requirements?
The industry is filled with anecdotal stories (some are very true) about the difficulty in gathering marketing's requirements when building a marketing database.
Because marketing constantly tries new ideas, tests results, and compares one group to another traditional requirements around 'what reports would you like to see' simply fails to capture the essence of the job. Instead, successful implementations base the design of the marketing database on the concepts of events and context.
Events are those marketing and customer activities that are relevant to executing and understanding the process. For example, this would include 'Contact', 'Request', 'Registration' etc. across channels. Start by listing all the specific events from the beginning of the customer journey to end.
Context is the information that helps marketing understand the 'who, what, when, and why'. For each event list all of the possible questions that need to be answered to fully comprehend a specific event.
A successful design allows a marketer to easily understand and talk about the events and context when segmenting, profiling or selecting people for campaigns.
Don't stop the exercise because 'that data isn't available' --- this is a logical problem first and foremost. A good design allows data to be added over time as required without restructuring the system.
Friday, October 20, 2006
The Math of ROI and the Budget Deficit
How can one question have two answers?
In this election season lots of candidates are talking about the deficit. And you can find two numbers circulating: $260 billion and $560 billion. The difference is obviously 'real money' according to the quote attributed to Senator Dirksen.
The argument goes something like this:
Deficit equals revenue less expenditures. So far, so good.
However revenue consists of tax collections plus borrowed funds. Since one would expect to repay a loan, or we're just robbing Peter to pay Paul, it should be accounted for in the figures.
When considering all sources of income, the deficit is $260 billion.
When considering borrowing as only a temporary source, it is $560 billion.
A similar scenario occurs in evaluating marketing programs. ROI is often portrayed as (Profit - Costs)/Costs. But profit should only be the incremental impact of the campaign since in most cases some customers would have bought anyway.
Focusing on the difference between actual and estimated sales has a long history in the syndicated market research world, it is less common in the direct marketing world. Something to work on.
DMA Buzz
What got the excitement meter up at this year's show?
It seems that the consensus circulating a few days after the show is that there really wasn't any buzz on the exhibit floor this year. Could mean one of three things:
1. We're in the trough between two hype cycles,
2. We're so jaded by advertising that we've tuned it out, or
3. We're just getting on with doing the work.
It was unfortunate that the 'Interactive' hall was separated from the 'Multi-channel' hall. It made for some long walks.
Thursday, October 19, 2006
Good Reading Material
Where can you find interesting reviews of marketing technology?
David Raab, now president of Client X Client, publishes his thoughts on products as well as an interesting view of industry white papers on his new blog.
Also, Kevin Hillstrom publishes thoughts on database marketing and multi-channel marketing on his blog.
Both are worth a read. Links to the left.
David Raab, now president of Client X Client, publishes his thoughts on products as well as an interesting view of industry white papers on his new blog.
Also, Kevin Hillstrom publishes thoughts on database marketing and multi-channel marketing on his blog.
Both are worth a read. Links to the left.
Totems, Parables and Stories
How do we learn?
One of the most effective ways of communicating is through stories. Most cultures, including organizations, teach through storytelling - be it verbal or visual, as in the case of totems.
Even when presenting the 'hard facts' we often turn them into vignettes. You know this is coming when listening to a presentation and the speaker follows up the numbers with "For example ...." I was once asked how large the forecast error was for a retail chain. The answer, at least in terms of metrics, was right there in terms of RMSE - but that didn't equate. The message that did work was: we're off by about one full shopping cart every six months. Technically the same metric, only the context changed.
It seems the secret to communicating metrics is to first convert them into everyday terms the audience understands.
Wednesday, October 18, 2006
Sampling: When less is good enough
Why do we use a subset?
We sample for one of three reasons: to prove, project, or probe.
Prove: provide credence for a given point of view or confirm a suspicion. Surveys are often done by companies or politicians to justify a position. Not bad in and of itself, but taken for what it is. They may include two steps: First, is something important and second are you doing something about it. Often known as the "gap" approach. In customer analysis it is often common to find a sample used as a matter of convenience for understanding behavior. Many companies have a sandbox for asking questions of the form: Do customers {fill in hunch here}?
Project: when you need the "true number" and asking everybody costs too much in terms of time or money. In this case care is taken in the sampling and weighting of that sample to ensure that the results mirror the larger population from which it is taken. Market share from panel data, media ratings, etc. are good examples. Daily political surveys may or may not be good.
Probe: when you need to understand how different groups behave or respond to marketing ideas. The compare and contrast approach rests on relative differences more than absolute numbers. The champion-challenger approach to message testing is a classic example.
Sampling is a powerful tool, but it is important to use the methods appropriate with the objective. For instance A/B testing does not need static samples and complex projection schemes.
Tuesday, October 17, 2006
This is why we test
In a synopsis of the DMA06 activity and other news, results of a new study on targeting was highlighted. The point is that until we try, we won't know.
Study Finds Customized Segmentation Beats Automated Targeting
Behaviorally targeted ads are more likely to generate higher conversion rates in customized market segments, compared to automated pre-packaged rules-based targeting, according to new study findings released by BL Labs of San Jose, CA. The study concludes that online advertising networks need to focus on custom segmentation and data analysis to optimize the nuances of behavioral targeting. Although online ads placed with contextually relevant content are likely to generate higher click through rates, ads shown with unrelated content typically pulled higher conversion rates. For example, the study found that advertising targeting travelers achieved the highest click through and conversion rates when placed on food Web sites.
The Envelope Please
Is the CMO is the new CIO
Ten to fifteen years ago the CIO had longevity similar to today’s CMO – about two years.
At that time there was a joke circulating around about what it took to succeed as a CIO.
A new CIO asks his predecessor for insight on how to be successful. The former CIO replies "when times get tough, open one of the 3 envelopes I left for you in the desk". Needless to say, times get rough so the CIO opens the first envelope and it says 'decentralize everything'. Things improve then degrade -- second envelope says 'centralize it all'. Things get better then fall apart -- third envelope says 'fill out three envelopes.'
Are branding and direct today's equivalents?
Like the IT dilemma, it is by no means an either or scenario -- but both. This point was repeatedly made at this years DMA.
Monday, October 16, 2006
One to Many
Do you eat your own dog food?
It seems odd to me that one of the leading proponents of 1 to 1 marketing doesn't actually follow its own recommendations. I now get 3 copies of the print version of their magazine, even after emailing them with the necessary changes.
As they say there should be a way to manage one's own preferences.
Friday, October 13, 2006
Enterprise Platforms
Does one size fit all?
In CIO and CFO circles there are valid arguments to 'standardize on one enterprise platform.' But in the realm of Business Intelligence there are some subtle and not so subtle differences between various segments.
Consider the standard types of "Business Intelligence"
1. Management Intelligence -- are we running the business according to plan?
2. Operational Intelligence -- are the processes working correctly?
3. Customer Intelligence -- how does marketing impact customer behavior?
4. Market Intelligence -- where are we headed?
5. Competitive Intelligence -- how do we fare with respect to the other guys?
I'm still hard pressed to think that one platform can support all of those needs. Technology is versatile, not omnipotent.
Data Driven Marketing
What is coming down the road?
A little while ago I wrote an article on things I'd like to see more visible in marketing analytics.
In summary:
1. Integrate survey and other syndicated data with house and prospect files. This type of augmentation takes the concept of overlay into lightly-chartered territory.
2. Merge marketing mix modeling with database marketing to get an end-to-end allocation of resources and people.
3. Shorten the path between analysis / reporting to campaign execution by developing truly integrated tools.
4. Continue focusing and measuring the influence of marketing spend on specific individual customer behaviors.
Thursday, October 12, 2006
Free Market Analytics
Recent announcement: Netflix Offers $1 Million Prize For Improved System
The objective is to improve ratings by a minimum of 10%. To help you Netflix will provide a sample (100 million records, so don't be looking at Excel). The objective is to close the gap between 'predictied rating' and 'actual rating.'
At last count there were 9,000 teams and over 150 entries to date. Nobody's close yet.
Lessons from Big Oil
When is your brand's Hubbert's Peak?
In any market there comes a time when production peaks and then begins to decline. In the global petroleum business Peak Oil is the date when production starts to decrease. Early in the life cycle production increases as infrastructure is added. Later it falls as resources are depleted.

Some time soon, the oil category will peak.
Looks similar to any product lifecycle chart I've seen.
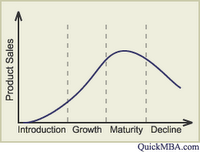
At some point, product sales slip into decline.
Now distribution represents infrastructure.
And demand represents resources.
The difference between brands is often how long the 'maturity' phase lasts. In the case of oil the peak is a singular moment in time. For a lot of products it is often a flat line for some period.
The point remains, at some point we need to plan for product obsolescence: How do we manage relationships with customers? When the firm IS the brand, this gets a bit tricky with the short-term focus of financial markets.
In any market there comes a time when production peaks and then begins to decline. In the global petroleum business Peak Oil is the date when production starts to decrease. Early in the life cycle production increases as infrastructure is added. Later it falls as resources are depleted.

Some time soon, the oil category will peak.
Looks similar to any product lifecycle chart I've seen.
At some point, product sales slip into decline.
Now distribution represents infrastructure.
And demand represents resources.
The difference between brands is often how long the 'maturity' phase lasts. In the case of oil the peak is a singular moment in time. For a lot of products it is often a flat line for some period.
The point remains, at some point we need to plan for product obsolescence: How do we manage relationships with customers? When the firm IS the brand, this gets a bit tricky with the short-term focus of financial markets.
Fluid Segments
Why do we need leaky buckets?
Most approaches to marketing base execution on segmenting customers or prospects. So far so good.
Using a top-down, hierarchical system similar to the Dewey Decimal system for books requires that each and every customer be in one and only one slot. This requirement rests on the ability of some central authority to make that decision. It can result in some quirks: Books on office productivity, e.g. "Word" are in both the 000s (Generalities) and five stacks away in the 600s (Technology).
However, segmentation is fluid with respect to both time and objective. Customers change and our reason to communicate changes.
A more natural tool for segmentation may be the concept of 'tagging'. Joshua Schacter, founder of Del.icio.us and MIT Technology Review's "Innovator of the Year" has shown that using user-defined categorization (segmentation) ends up being a pretty good way of organizing the web. At any point in time a Web page may have any number of descriptors as a way of improving memory and recall.
Since a customer can be both "High Value" AND "Vulnerable" at the same time; additional flexibility in segmentation schemes is required and tagging makes an interesting choice.
Wednesday, October 11, 2006
Remarkable Analytics
Why do we need to analyze?
Seth Godin summarizes it well in The Purple Cow: "Marketing isn't guaranteed."
In the face of that fact there are three paths we could take regarding measuring marketing's impact. First, we could stick our heads in the ground and not worry about it. Second, we could throw spaghetti on the wall and see what sticks-- or is that sales? Third, we can try to figure out what actually works.
Some simple logic suggests option three is the only viable route. It's budget season so I'm willing to bet most firms are going for a growth rate that exceeds the category average because 'we're better'. Now what is in short supply when each individual firm estimates growth greater than the overall market? Customers. They are the scarce resource So, achieving our objectives must come at the expense of the other guys. That means our analytics have to be sharper, quicker, and more in tune with customer needs. Or in the vernacular of the Cow -- "remarkable."
Combinatorial Complexity
Are there too many good ideas to test?
We often have lots of ideas that we know we should test, but sequentially going through the list would take forever and a day. The good news is that this problem is readily solvable using something called experimental design.
On a replay of a Direct webinar on multi-variate email testing Katie Cole of MerkleQuiris addressed this issue and stated something like “our account managers love to say fractional factorial in a sales meeting.”
Obviously alliteration; but what does it mean?
When designing a campaign we can use any number of factors – creative, list, segment, offer, etc. each with any number of variations. If we want to test this whole lot we need to consider ‘multivariate testing.’ Note that the old A/B test is the simplest case: One factor with two variations. When lots of factors are involved the number of possible combinations is simply the product of the number of variations for each factor.
For example: If an email test has 3 subject lines, 5 lists, and 4 segments and we evaluate all 60 possible (3 * 5 * 4) versions we’d be doing a ‘full factorial’ test.
At some point there are too many combinations to test. Imagine adding text vs. html, three wire-frame layouts, ads on left or right side, three offers located in four locations. Now we have over 14,000 combinations! This is where ‘fractional factorial’ comes in. It is a means of systematically reducing the number of combinations to a manageable number but still retaining the ability to answer some, but not all possible questions.
The smallest magic subset of combinations allows us to test the fundamental questions about each of the major factors:
- Does subject line matter?
- Does list impact response?
- Do segments behave differently?
- etc.
As more combinations are added to the mix we can ask questions with nuance.
- Does the choice of list impact how the subject line works?
- Does format affect the click-through rate of ad location?
The only way to answer all possible questions is to test all possible combinations – full factorial. However, in the majority of cases we’re not looking to understand the subtleties of how each factor interacts with each other. We want to know the major levers to customer behavior.
Like triage, ‘fractional factorial’ focuses on the important cases and allows us to assess the big questions of campaign design. Once we’ve identified the factors that drive behavior we’ll work on fine tuning the variations.
Tuesday, October 10, 2006
Cross Category Analysis
How do I identify products for acquisition or cross-sell strategies?
I want to see the impact of each and every product (SKU) in my portfolio in terms of its ability to generate incremental penetration. I don't want to look within a category, but across them all.
Reason: Products that attract customers should be marketed differently than those that reinforce the decision.
Role of Fly Fishing in Marketing
What does feather tossing have to do with marketing?
In a word, image.
Since the mid-nineteenth century fly fishing has been at the center of image marketing.
First there was Cornelia "Fly Rod" Crosby the women who marketed Maine as the 'playground of the nation' where visitors could experience the 'wilderness with all the comforts.' Now the companies behind this campaign were the railroads since that was the only way someone could get to the backwoods. They sponsored casting clinics in Central Park to entice people to travel to Maine.
Hiram Leonard, Eustis Edwards, and a few others became 'signature brands' as makers of bamboo fly rods. As they became popular, it wasn't unusual to partner or be acquired by more 'business-focused' firms who needed to figure out how to go from a couple of dozen rods per year to 1,000+. The impact of technology, e.g. beveling machines of the late 1870s, on a craft business makes for interesting reading in "Casting a Spell" by George Black.
Orvis, which started issuing catalogs prior to the Civil War, focused on the total image starting in the mid-1960s. Leigh Perkins, who had bought Orvis in 1965 described the company as 'what we were creating and selling was, for a lack of better word, a lifestyle, a kind of Americanized version of elegant, English country living.' For several years Orvis swapped house files with the likes of Abercrombie & Fitch and L.L. Bean as part of its direct marketing program.
Robert Redford's "A River Runs Through It" based on Norman Maclean's novella is credited with spawning (or ruining) even more interest in fly-fishing. Since the movie's debut in 1992 western trout streams have seen a lot of 'image pressure' - fishermen (and women) who look good but don't catch much.
Monday, October 09, 2006
Making it Easy to Sell Makes it Hard to Buy
At what point does choice become too much?
We’ve all been taught that being a leader in a category is critical to success. Just search on the phrase “industry leader” on any job-posting site to see how far this has been taken.
The argument for categorization is usually one of two: People remember leaders and/or people buy from leaders. Since we seem to have an innate ability to remember ‘the first’ in an infinite number of categories it makes sense to be #1 in something. Recalling brand #2 is difficult; Avis not withstanding.
But at some point does this fragmentation work against us? Is there a point at which the resulting ‘hyper-choice’ turns us off?
Personally – yes. I have not bought, when I thought I wanted to, because of too many options and no simple way of paring down the choices to a relevant set. It also appears to be real in the grocery store as well. Fewer options on the shelf result in higher sales.
Relevance applies to the set of choices as much as it does to any other “P”. While narrowing options is much easier to do on-line via search and tagging than it is on a shelf, it is still too feature driven (4 mega-pixel vs. 5 mega-pixel as if I care or even want to know). It is still rare to find tools that are situation or need driven. For a cool one, see www.noodletools.com.
Identifying segments based on need will require profiling, quite possibly in the Quantico sense.
Significance vs. Substance
Does your analysis have 'oomph'?
Apparently this is technical term in economic circles -- it summarizes the idea that 'statistical significance' is not what analysis is about. Rather the focus should be on How Much of a difference something makes not Whether it makes a difference.
Deirdre McCloskey makes this point in Secret Sins of Economics.
In short, statistical significance is neither necessary nor sufficient for a result to be scientifically significant. Most of the time it is irrelevant. A researcher is simply committing a scientific error to use it as ….an all-purpose way of judging whether a number is large enough to matter. Mattering is a human matter; the numbers figure, but after collecting them the mattering has to be decided finally by us; mattering does not inhere in a number.
The point is that we should ask: How much impact does {insert variable here} have on customer behavior?
For marketing the question isn't whether something is significant but rather whether it has substance - or oomph, a term that fits well in the creative vernacular.
Friday, October 06, 2006
Marketers are Unreasonable
The reasonable man adapts himself to the world: the unreasonable one persists in trying to adapt the world to himself. Therefore all progress depends on the unreasonable man.
GEORGE BERNARD SHAW, Maxims for Revolutionists
Marketers are the one function in the organization charged with changing the status quo. They alone are responsible for new products, new markets, new segments, and new revenue.
They define a vision of what should be and then they test, tinker, and tweak how things work in order to alter customer behavior to get there.
So a message to IT: Please forgive their 'unreasonableness' for they are paid to be so.
Overlapping Networks
Is MySpace where the LinkedIn crowd hang out after work?
It has certainly has been stated that LinkedIn is for adults. But like any two products in a category, they each have there own persona.
- LinkedIn makes its money capitalizing on the age-old adage: "It's not what you know, but who you know."
- MySpace makes its money reaching a key demographic: "It's not what you know, but who you are."
Originally started with executives in mind, LinkedIn has moved 'down-market' as it grows to an estimated 10 million users by year end. Originally started for adults (but not adult content), MySpace has proven attractive to younger audiences with its 100 millionth account created this summer.
The odds of overlap are pretty small in absolute numbers (no more than 10% of MySpace could have a LinkedIn profile.) Of my extended network of 1mm+ LinkedIn users the phrase "MySpace" returned only a couple of hundred people. Now I'll admit many may not cross-post in order to separate their after-hours life from their day job.
[UPDATE] - Age profile of MySpace getting older. Half of the users are over 35, up from nearly 40% last year. So, is the brand diluting?
Thursday, October 05, 2006
Pulling the nth Degree
Is nth-selection random?
Recently asked the above, and like all questions these days it seems the answer is 'it depends'.
Picking every 4th, 10th, 100th etc. name as a way of sampling is often described as 'random'. Two practical scenarios make this unlikely.
Say I need 10,000 names for a test from a house-file of 10,000,000. If I pick every 10th or even 100th name I will only go through a small portion of the whole list. So, if that list is sequenced by anything meaningful like age of account, last name, value, etc. I end up with a biased list. And most database administers will order a file by some attribute to speed load, linking, and indexing.
When doing repeated pulls over time nth selections may result in the same list being pulled. Changing the starting point or randomly sorting before the pull minimizes this risk.
Random assumes that every record has an equal chance of being selected -- while nth is a means of sampling, it is by no means random. Once the first record from a list is flagged the chance of pulling any other record is defined.
Whether this matters a hill of beans or not depends a lot on why one samples in the first place. (More on that soon.)
Marketing Hiring Practices
Have we closed the skills gap?
The need for analytic and technical skills has been argued for a while now.
Time - late 1998: In a CIO Magazine article entitled "Improving the Odds"
.... marketing takes a dominant role in shaping organizations' interactions with consumers. Marketing thus becomes the company's darling and the information systems (IS) department's new best friend. ... To rise to the challenge of leading the rest of the company into the new customer-centered paradigm, marketing must get itself in shape.
Time - early 2005: CMO Magazine (now disappeared) but cache is available. In an Editorial entitled "Eat Your Own Dog Food"..
What can Brown do for you? I don't know this Brown dude, but if he's good with either numbers or technology, hire him. CMOs need to expand the skill sets of their personnel if they want to increase the profile and the impact of marketing.
Time - this week: In Intelligent Enterprise on the topic of analytics (web in particular) :
The level of sophistication in using analytics tools runs the gamut.... A big part of the difference has to do with the way people think and their corporate culture. .... Left Brains Needed
We've made progress, but apparently not enough.
Wednesday, October 04, 2006
Process is the New Black
What's in fashion these days?
On the runway some color, fabric or style becomes the 'new black' -- that indispensable item that is the basis of any wardrobe.
In the realm of analytics there is a new kid in town: "Process"
In "Competing on Analytics" Tom Davenport argues "business processes are among the last remaining points of differentiation" and that success comes from using analytics to "wring every last drop of value..."
In "An Analytics Manifesto" Neil Raden lays out arguments for an architecture that "enables vastly smarter business processes."
Both are saying that "analysis" should be pervasive and the foundation of any business wardrobe. I agree, particularly since analysis is all about understanding what's going on and then doing something about it. Davenport often uses a core, high-end predictive modeling group argument; Raden argues for an embedded approach. In any complex business, and aren't they all, both strategies are appropriate. The deciding factor of which approach is right depends on the risks of being wrong. Ok, this is beginning to sound like a Head vs. Long Tail of analytics argument.
It's also noteworthy to look at who sponsored the research: SAS in the case of "Competing" and SAP in the case of "Manifesto". Now, neither company is known for the contra position, i.e. nobody would implement SAS for resource planning and they wouldn't use SAP for advanced statistics.
The positioning aside, both articles point to the conclusion that this is different than how 'business intelligence' tools approach the problem. SAP in particular is positioning process-embedded analytics for Everyman. Their argument is based in part on the fact that there are 100 times more Excel users than all Business Intelligence tools combined.
If I were a cynic I'd argue: The BI vendors had 15-25 years to get it right, and didn't. So let's try another route. Given that SAP BW isn't highly regarded as user friendly, that's not much of a stretch.
Back on the serious side: providing people with the events, context, alternatives and potential impact necessarily for their roles is a very good thing.
Do not test creative, assess the results
Putting emphasis on what is important.
There is a world of difference between 'the creative isn't good' and 'we didn't meet objectives'. The purpose of testing is to figure out what works in terms of shaping and capturing the desired customer behavior. Thus, all tests should explicitly, and before the fact, define what the goal is and how it will be measured.
Kind of like the scientific method.
Moneyball: The ultimate in being data-driven
Why is this book important to marketing?
 Usual reasons include:
Illustrative use of information to run a business; it does.
A good read anyway; it is.
Key point: Measure that which causes success. It isn't always the stats (dare I say Key Performance Indicators) of conventional wisdom that relate to success. For instance while 'batting average' may raise the payroll it has little to do with understanding whether a team produces more runs than its opponent. Unheralded metrics like 'base-on-balls' do better.
It is a story about using the specific metrics that relate to game-day performance, as ultimately measured by W-L, to guide investment in players. Its even spawned its own discipline "sabermetrics" loosely defined as the objective search for what works. So when building a Marketing Box Score, make sure to include those metrics that actually relate to the objective --- financial performance.
Tuesday, October 03, 2006
Customer Capacity and Headroom
How much can a customer consume?
Recent article I wrote on using capacity as a means of targeting can be found on Chief Marketer.
The main point: Customers have value to the firm as well as an overall capacity to consume. The difference between the two, e.g. headroom, makes Life Time Value a two-sided question. How much do I satisfy their needs? How large is their total need? This can be summarized in the following matrix:
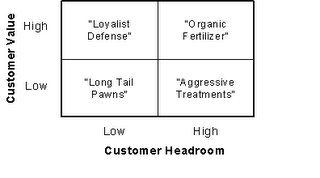 Based on the value and headroom, different segments emerge - each with their own strategy.
Even 'high-value' customers can be segmented into those who are sated and those with lots more room.
Yes, No,or Something In Between
When is an average wrong?
Most events marketing is concerned about are binary -- that is they happen or they don't. Buy, cancel, respond, churn, request, register, and click are all examples of a behavior that either occurs or it doesn't. Given that it is probably impossible and certainly impractical to categorize people into one of the two camps for future campaigns we've come up with some ways of estimating the probability that a customer or prospect will do something. Now we have values that look continuous from 0 to 1.
However, there are risks in interpretation when doing numeric gymnastics.
When reporting this likelihood with an assigned value to it, e.g. estimated sales revenue, strange numbers can occur. For instance, consider an email campaign where responders will spend $100 and non-responders will spend $0. The average may be $50 but the expected value isn't that at all if conversion rates are anywhere close to typical. The likely contribution for a 1,000 mailing with a 2% conversion rate is $2,000 (1,000 * 2% * $100) not $50,000 (1,000 * $50).
And yes, these simple errors are made. And they do impact decision making.
A widely publicized example comes from government circles. In 2000, the USGS published a tome about the status of known oil fields and the likelihood of finding more. Using the math similar to the email campaign it was concluded that there is a lot of oil to be found in Greenland.
- 5% chance of finding 112 billion barrels
- 95% chance of finding 1 barrel
- Average reserve is reported as over 47 billion barrels
With that figure, which is twice the size of the estimated reserves of the US before the recent find in the Gulf, a lot of attention has been paid to an area that has produced little to date.
Using the email logic, the expected value should probably be somewhere in the 5 billion range, or the size of the United Kingdom. Or less than a year's supply.
Monday, October 02, 2006
Search, Shopping and Trademarks
How do people approach the search problem?
Hitwise just released the dog-days of summer shopping activity. But are all the product searches for the actual term used?

Searching is all about figuring out how best to reduce the clutter to find what's relevant. And at present we are more or less limited to using the text box without any help. Sometimes broad categories work, like those in the 'generic column'. Other times specific terms help constrain the results better. There are times when a brand name is the best tool for finding associated content. This is akin to using collaborative filtering and entering a book you already own for the sole purpose of finding other suggestions.
So how many people were searching in the general sense as opposed to specifically looking for barbie or ipod? Can this distinction be used to drive traffic?
Now what happens when somebody pays money for a key word that is a trademark owned by another. Is that legal? Appears to be. Google had a case against them dismissed as to whether competitor trademarks could be used in keyword searches. The argument (and I'm no lawyer) is that infringements occur when the trademark is 'use[d] in commerce' meaning some public display, e.g. on a product, in advertising etc., that a consumer can see. Apparently the internal machinations of ad-serving and page ranking don't qualify as 'use in commerce', although they do generate a lot of revenue. For a discussion of the use of a trademark in search for see Eric Goldman's blog and article on the topic.
BTW: I wonder what the age profile is of a 'generic' vs. 'product' searcher looks like? Is there a skew in how people search when shopping?
And yes there 100+ 'lingerie barbie' results on eBay.
Hitwise just released the dog-days of summer shopping activity. But are all the product searches for the actual term used?
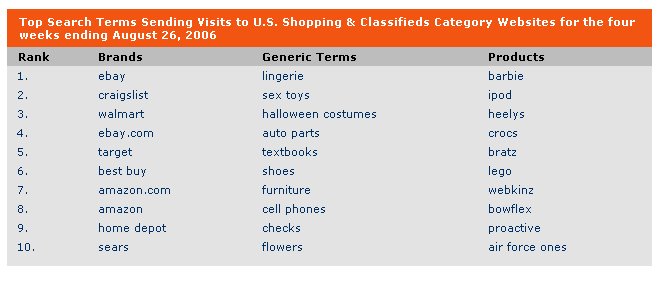
Searching is all about figuring out how best to reduce the clutter to find what's relevant. And at present we are more or less limited to using the text box without any help. Sometimes broad categories work, like those in the 'generic column'. Other times specific terms help constrain the results better. There are times when a brand name is the best tool for finding associated content. This is akin to using collaborative filtering and entering a book you already own for the sole purpose of finding other suggestions.
So how many people were searching in the general sense as opposed to specifically looking for barbie or ipod? Can this distinction be used to drive traffic?
Now what happens when somebody pays money for a key word that is a trademark owned by another. Is that legal? Appears to be. Google had a case against them dismissed as to whether competitor trademarks could be used in keyword searches. The argument (and I'm no lawyer) is that infringements occur when the trademark is 'use[d] in commerce' meaning some public display, e.g. on a product, in advertising etc., that a consumer can see. Apparently the internal machinations of ad-serving and page ranking don't qualify as 'use in commerce', although they do generate a lot of revenue. For a discussion of the use of a trademark in search for see Eric Goldman's blog and article on the topic.
BTW: I wonder what the age profile is of a 'generic' vs. 'product' searcher looks like? Is there a skew in how people search when shopping?
And yes there 100+ 'lingerie barbie' results on eBay.
Pacifier for 140 mph
When is enough too much?
NASCAR is moving the way Harley-Davidson did with licensing and brand extensions that make little sense relative to the brand itself.
Last year Harley-Davidson a 'cake-decorating kit' was voted as being the worst extension in a Tipping Sprung, Brandweek survey. To give them credit the company won the year before with a foot-wear extension. I can imagine footwear that is 'rebellious and edgy'; I have a hard time with a sheet-cake being described that way.
Now NASCAR offers baby pacifers with the number of a favorite driver -- doesn't have the lead brand that's emblazoned on uniforms and cars, which is often an adult-focused co-brand like 'beer'.
On a morning news show today an executive said something along the lines of ‘If we get them young, we’ll keep them old.’ Sounds like the old tobacco and liquor marketing. While NASCAR generates $2 billion in merchandise sales and boasts 75 million fans; this kind of extension is just a bit too much.
Besides, I still prefer racing that makes right turns.
Friday, September 29, 2006
Analytic Paradox
Why are simple questions so difficult to answer?
A few years ago I wrote an article about this one. The basic premise was that a lot of marketing questions like "how have our customers changed?" weren't easily defined in terms of predefined 'dimensions and facts'. The argument was made that the available tools didn't fit that kind of question; they were built for more structured ones like "what is the sales split by standard segment?" While important, it wasn't going to help find something new that could be leveraged.
At the time I argued that
The technology should be indifferent to what you ask and where you want to go. It should be just as adept at manipulating the non-buyer as it is the buyer, such as creating a segment of people who haven't bought in the past six months. There should be no proscribed paths for navigation. And all of this must perform at train-of-thought speeds so that the "Aha!" moment isn't lost while watching the hourglass, or worse, waiting for a new report or database to be built.
In short there should be no penalty for asking a new question. Still think the above is true, but rather than a tool targeted just to marketing there are general needs in the business for such flexibility. Maybe the next generation of tools will mutate enough to drive the marginal cost of a new question to zero.
Type Casting Errors
What's in a phrase?
A recent post in the Direct Newsline recapped a press release from Lyris saying that email "False Positives" were still a problem. While the overall point is there is too much junk mail, I wondered just what exactly does this mean?
Had to go dust off a few things to figure that out.
A recent post in the Direct Newsline recapped a press release from Lyris saying that email "False Positives" were still a problem. While the overall point is there is too much junk mail, I wondered just what exactly does this mean?
Had to go dust off a few things to figure that out.
Consider the question: “Is this email spam?” If this statement is true, then I will block the email.
Reality is either True or False in that the email either is (true) or isn't (false) spam; however, the test could be wrong in one of two ways.
- I let it pass when I should have blocked it. This is False Negative- a spam email I have to suffer with.
- I block it when I should have let it through. This is False Positive- a good email lost.
Note that the question could be asked the other way: “Is this email safe to pass on?” In this case ‘truth’ is associated with passing it along.
- I let it pass when I should have blocked it. False Positive- more junk email.
- I block it when I should have let it through. False Negative- less requested email.
So,
False Positive means saying yes when you should have said no.
False Negative means saying no when you should have said yes.
Confusion over a phrase like "False Postives" arises because it depends on whether the question is either "is this spam" or "is this from a requested sender." In the first case higher false positive rates relates to loosing good email in the second it means more spam.
The consequences of being wrong are often very different depending on which side of the question you land. The American judicial system knows this well -- the emphasis is to err on the side of innocence not guilt. Consider business email vs. personal email at home where the need for filtering may be different. At work, I'll take a little garbage to make sure I get all of what I need. At home, I'm more likely to eliminate all garbage even at the risk of losing something that might be of interest.
This leaves us with two specific questions with respect to managing the cases where we are wrong.
1. What specific question are we answering?
2. Which type of error is more critical to the business and customer relationship? Blocking too much or allowing too much?
Both questions are important and should be considered in deciding how to filter email as well as any other activity where decision rules are put in place.
Thursday, September 28, 2006
The Killer App is Killing Us
The spreadsheet has been heralded as the killer app that drove PC penetration into business (not to mention the Blue brand). The argument was that it reduced errors in manual computations and made repetitive calculations faster. Both probably true.
However, spreadsheets contain errors. For some of the more interesting ones see the web site that tracks them. Articles summarizing research shows an error range of 20-40%. Estimates of $10 billion in errors have been reported. From personal experience I know of two audits of 'production processes' that used spreadsheets where 100% (read "every d*** one") contained errors. We simply weren't consistent across projects or markets. In both cases, real money was at risk since they controlled pricing and product quality.
Bad spreadsheets aren't an IT issue; they are a management issue and go to the heart of data-driven marketing. Please have an outsider from your department look at the mechanics and logic of your spreadsheets.
Wednesday, September 27, 2006
Left Brain Marketing Requires Right Brain Technology
In a joint think tank session with former Forrester analyst Eric Schmitt, the author of Left Brain Marketing, I argued that even with the move toward more analytic rigor, i.e. left-brain dominance, marketing tools still needed to be right-brain driven. Why?
The nature of marketing is to change the status quo: New markets, new products, and new customers. Moving the needle on proverbial dashboard means trying, experimenting, and testing new things which in turn requires extremely flexible tools. There just aren't that many out there that support the style of analysis and questioning that marketing needs to do.
Marketing must be able to define its requirements at the time the question arises, not six months earlier. So when evaluating tools, do it live with real data and real, unplanned questions.
Not Very Insightful
What's wrong with this picture?
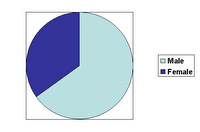
I recently had the opportunity to review a customer profile analysis. The two basic questions were:
1. How do my customers differ from the general audience?
2. Are there differences across our brands?
I suppose that the results would help provide input and insight into all types of issues -- branding, promotion, creative, etc.
For each demographic variable, there were five pages that looked like the above. Points:
1. There was no summary answer to the questions.
2. It took much longer to review than necessary.
3. It was boring, making it even more difficult to answer the questions.
4. No added value since I don't consider converting a table to a chart a valuable service.
Unfortunately the analyst (or was it just someone used to working with desktop tools) missed the objective of the exercise entirely, which is to help us understand and provide guidance. A stack of charts doesn't cut it.
When preparing a presentation, reorganize material to fit the needs of the audience, rather than replicate the data crunching process. I would have liked to have seen two pages:
a. Comparison of customers to the general audience; highlighting where they differ.
b. Comparison across products; again pointing out differences in profiles.
The human brain, and hence the mind, is capable of absorbing a lot more than we give it credit for. Check out discussions and sites on 'visualization' starting with Stephen Few's "Perceptual Edge."
Finally, when presenting results be sure to answer the questions that funded the work in the first place.
Tuesday, September 26, 2006
Statistics Defined
How do I explain it?
As "Reducing risk by quantifying uncertainty."
For a variety of reasons we often use a small group of people to learn about the larger group from which it is drawn. Think A/B testing for example. To ensure we can generalize the results from a sample we apply statistics to estimate how confident we are in what we find.
A more complete defintion can be found on wikipedia.
Predictive Modeling
Just what does this term mean?
Simply put, predictive modeling puts truth in the phrase "the only thing new is history we haven't learned yet." It is a series of tools and techniques for a) figuring out what we don't know and b) how marketing variables impact choice.
Articles and posts often talk about it in the future sense -- will this customer churn? will that customer buy? While perfectly valid, predictive modeling is just as valid for figuring out the past and present as well. Estimating income, identifying visitors, and depicting fraud are all examples of predicting in the present tense.
In a lot of cases the result of the exercise is expressed as the likelihood that a customer will behave in a chosen manner or is somebody we've seen before or has a certain level of a desired trait. This approach has the benefit of allowing us to rank order customers or prospects as well as understand the levers that drive behavior.
How good that prediction is will be left to a future note.
Scientist as Brand
Technology companies often take the work of an academic or scientist and turn it into a product. In some cases the person becomes central to a specific brand; in others they form the foundation for a set of products.
Vladimir Vapnik is noted for his work in data mining products from KXen.
Genechi Taguchi, a Japanese expert in process manufacturing, is now often associated with several companies offering multi-variate testing of web sites.
Others?
Vladimir Vapnik is noted for his work in data mining products from KXen.
Genechi Taguchi, a Japanese expert in process manufacturing, is now often associated with several companies offering multi-variate testing of web sites.
Others?
Acronym Confusion
What's in a name?
For some reason we like to use acronyms, particularly three-letter ones to define something. Not sure why since it often leads to unnecessary confusion or debate. Do we really care about the nuances between Corporate Performance Management (CPM) and Business Performance Management (BPM)?
Their use creates some strange online results. Search for SEM and you get:
- Society for Experimental Mechanics
- Scanning Electron Micrsocopy
- Society for Ethnomusicology
- SEM Products (something to do with automotive repair)
- Security Engineered Machinery
Nothing to do with marketing or search. Given the state of context aware advertising, it is often possible to get ads for the above within a marketing site. Sorry about that pay-per-click, but had to follow some of those links.
TLAs are often an attempt to categorize things to make it easier to compare, but the boundaries are fuzzy. Certainly product and technology companies go this route. How often have you heard "We're not an SFA company, we're a CRM company." Maybe we should just say what we mean.
IMHO
Monday, September 25, 2006
Your Opinion Doesn't Count
So whose does?
In a recent post, Anne Holland of MarketingSherpa discussed the benefits of personas to marketing. To add my spin, they represent the soul and embodiment of a target audience. A good persona represents a single individual; not a typical 'average', not a composite, but a living breathing person that we can relate to and empathize with. Since we're all different, any given scenario is likely to have 3-5 personas.
Technology firms often uses personas as part of the development process. For instance Teradata's Relationship Manager is even marketed as a persona-based solution. Starting in the 80s as a means of improving product design, Alan Cooper focused on improving development by explicitly defining the target user. He has written several books on the subject; one of which is appropriate for marketing and appropriately titled.
Written for a business audience "The Inmates are Running the Asylum" makes a simple point -- we should design products before we build them. And in order to design, we must understand for whom we are building. The discussion goes on as to why software engineers are a different breed, making this more difficult than it ought to be. The point here is that marketing is no different: We must thoroughly understand with whom we are communicating.
To paraphrase the openings to Chapter 3 and 5: "It's harder than you might think to squander millions of dollars, but a flawed [marketing] process is well suited to the job. .... The real benefit of offering a well-[targeted] product or service is the fierce loyalty it generates in your clientele."
Now that's a plea for marketing to get involved.
Subscribe to:
Posts (Atom)

